OPIS Context
Help Guide
Your online home for current and historical OPIS pricing data, market commentary and analytics!
OPIS Context is a new delivery platform that turns your fuel and energy commodity price reports into interactive, dynamic tools you can use to gain even greater insight into the markets you care most about. Visit context.opisnet.com.


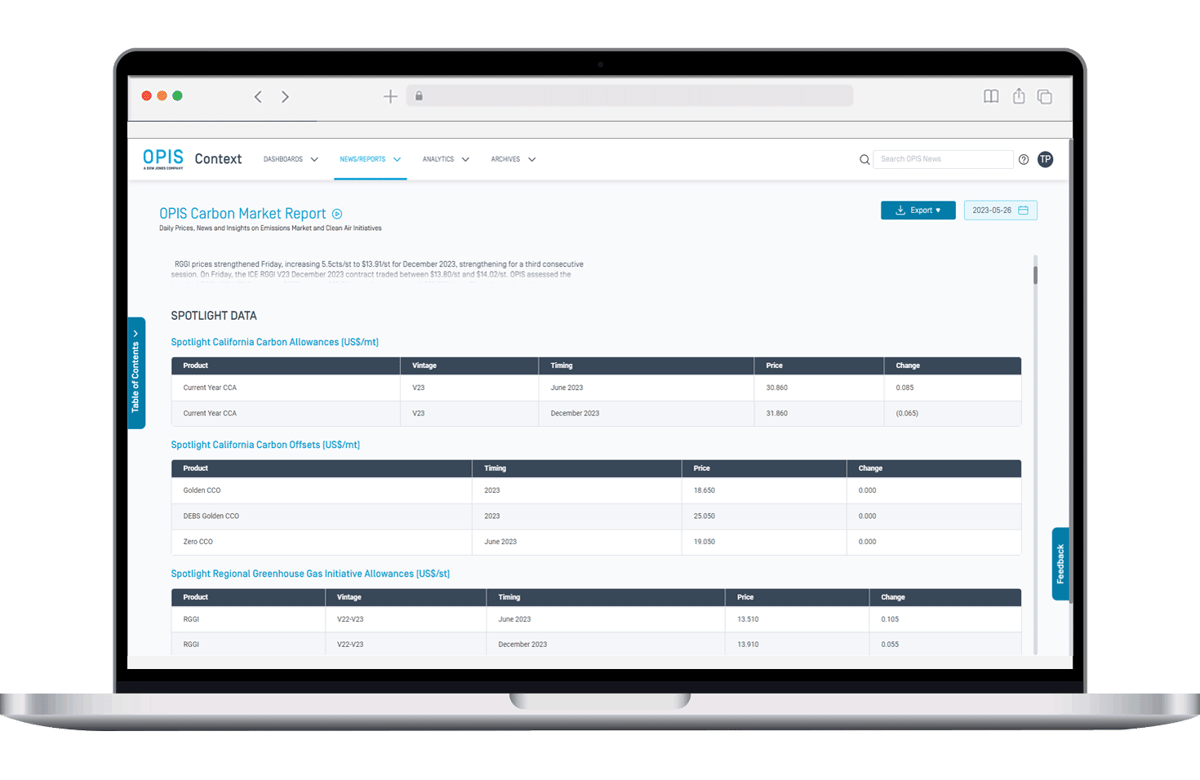
OPIS Context: OPIS Carbon Market Report

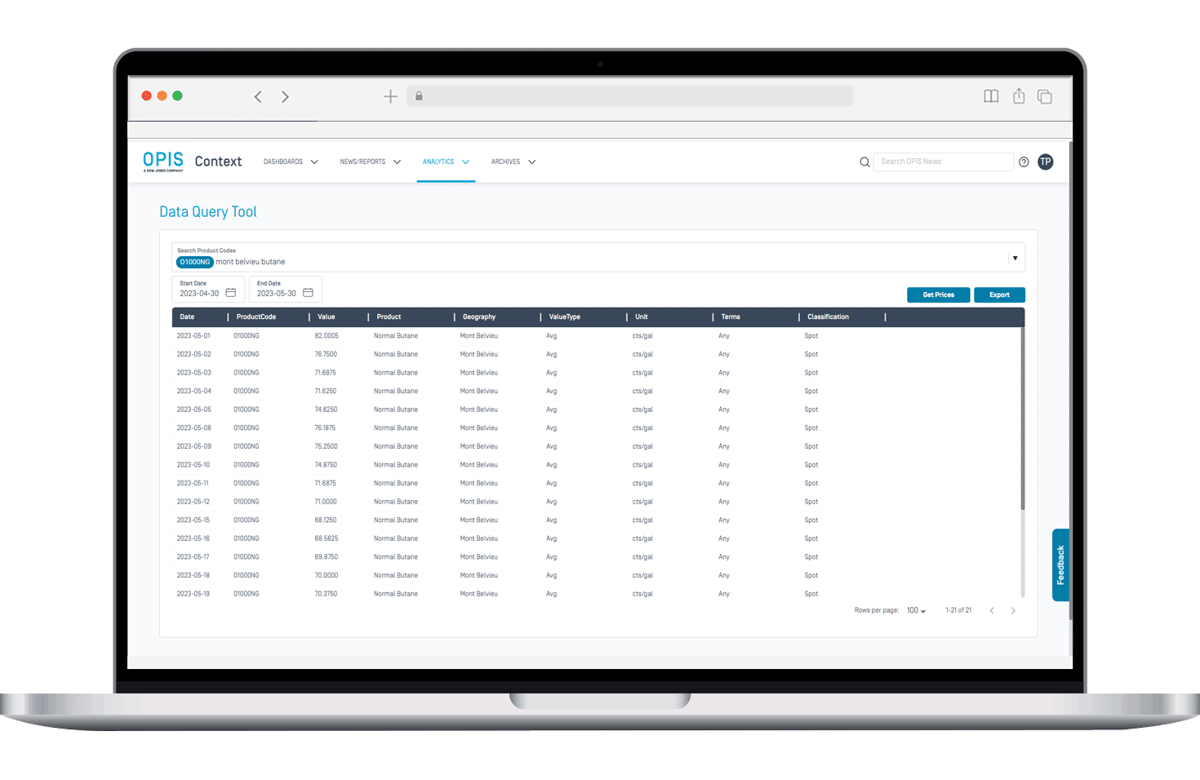
OPIS Context: Data Query Tools
Frequently Asked Questions (FAQs)
General | Dashboard | News | Reports | Data Query Tool | Archives | How-to Videos
GENERAL
What does using OPIS Context give me that I can’t get in the PDF I receive via email?
OPIS Context gives you the ability to:
• Find just the prices and information you need by creating custom dashboards.
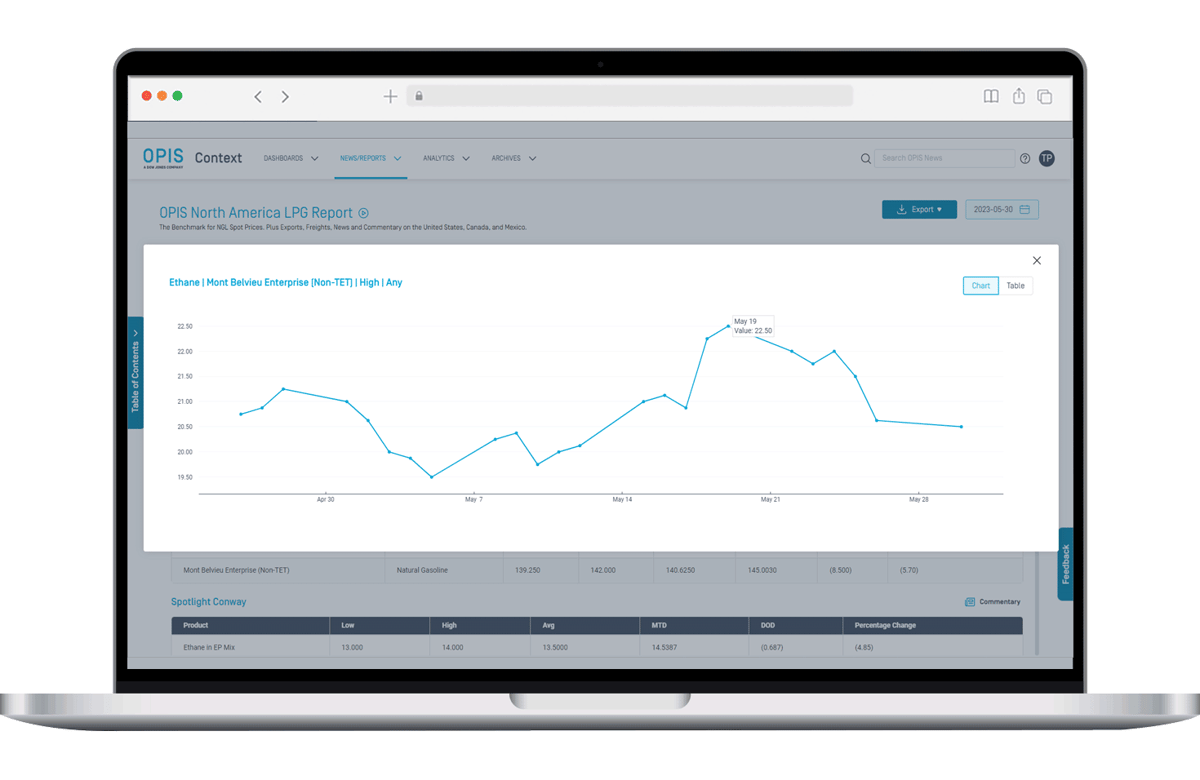
• See price trends by clicking on any price to see a price graph or table.
• Do your own analysis by exporting historical price data to Excel.
• Search news content (if it’s included in your subscription).
I prefer reading a PDF rather than a web page. Is there a way to download a PDF?
Yes. On any report page, click the Export button in the upper right, then choose Export to PDF. (Where available, Download Archived PDF will give you the report laid out like OPIS reports have traditionally been laid out. We will phase these reports out over time.)
How do I turn on or off email notifications?
Go to the User Profile menu (top right of the page) > My Profile > Notifications. From here you can toggle emailed publish notifications on or off for any reports you are subscribed to. Then click Save Changes.
How do I download historical price data?
In the Analytics menu, select the Data Query Tool. Use keywords or search by product code to find price data to download.
If your subscription includes API access, you can also use the OPIS Spot API at https://spotapi.opisnet.com/
I receive my OPIS report as a PDF that is emailed to me. How does the content in OPIS Context differ from what I get via email?
The content on Context is the same as what is included in the PDF even though the layout of the information looks a bit different. But Context lets you do things that the PDF can’t, including showing price graphs for any price, viewing historical data and searching text content.
How do I turn off notifications that appear on the bottom of the screen notifying me that new reports have been published?
Go to the User Profile menu (top right of the page) > My Profile > Notifications. From here you can toggle In-Site Notifications off. Then click Save Changes.
Can I get the same information on an app?
OPIS reports are not available on an app, but OPIS Context was built so you can easily use OPIS Context on your mobile device.
Add OPIS Context as an icon on your mobile device’s home screen to make it work like an app:
• On iPhone, open Safari and tap the share button. Choose Add to Home Screen from the menu.
• On Android, open Chrome, Edge, or Firefox and select Add to Home Screen or Add to Phone from the menu.
I have a suggestion about OPIS Context. How should I let you know?
Email us at ContextFeedback@opisnet.com. We absolutely love to hear all feedback and suggestions: what you like, what you don’t, how we make OPIS Context better for you.
What if I have other questions that aren’t answered here?
Contact us at energycs@opisnet.com or any of the methods listed here.
DASHBOARDS
What is a segment?
A segment is a component that is placed on your custom dashboard. Types of segments available are:
• Report Segment - price tables, graphs or text content that are found in the report(s) you subscribe to.
• Custom Segment - price tables or graphs with prices and layout that you specify.
• OPIS News Segment - available if News Alerts are included in your subscription.
How do I rename a dashboard?
Go to the More Options (three vertical dots) menu in the upper right next to New Segment. Choose Edit Dashboard, then click on your dashboard name to edit it. Then click Save Changes.
How do I rearrange the segments on my dashboard?
Go to the More Options (three vertical dots) menu in the upper right next to New Segment. Click and drag segments to rearrange them, or grab the corner of a segment to resize it. Then click Save Changes.
NEWS
The number of news stories in the left column is limited. How can I view older stories?
The most recent 150 news stories are listed. To find stories older than that, use the search box in the upper right of the page.
I don’t have access to News. How do I find out more?
OPIS Intraday News Alerts are an added subscription option. Find out more about OPIS Intraday News Alerts here and sign up for a free trial.
REPORTS
Why do I see some of my reports on Context but not all of them?
We are working on adding all OPIS Spot pricing reports to Context. The reports below are currently available on OPIS Context, and will be visible based on your subscription terms. We will make additional reports available on Context over the coming months. Contact your Account Manager or Customer Service to learn more about these reports or to add them to your subscription agreement.
• OPIS North America LPG Report
• OPIS Europe LPG & Naphtha Report
• OPIS Asia Naphtha & LPG Report
• OPIS Carbon Market Report
• OPIS Global Carbon Offsets Report
• OPIS International Feedstocks Intelligence Report
What are some tips for using Report pages?
1) Click any price in a table to see a graph of that price. When viewing the graph, choose Table in the upper right to view a table. (You can copy price data from here and paste into a spreadsheet.)
2) Click the Table of Contents button on the left side of the page. Click any heading there to jump to that section of the report.
Can I download the price data into a spreadsheet?
Yes. Choose Export then Export to CSV.
If you don’t see Export to CSV as an option in that menu, your subscription doesn’t include data access. Contact our Customer Service team at energycs@opisnet.com to find out how you can add data access to your subscription.
DATA QUERY TOOL
I can only download one year of history. How do I download more data?
If your subscription includes API access, to download more than one year of data use the OPIS Spot API at https://spotapi.opisnet.com/
I have selected a price, but now I only see the product code in the Search Product Codes box, not the product name. How do I see the name of the product I’ve chosen?
Hover over the product code to see the product name. The product name is also included in your search results.
How do I download historical price data?
In the Analytics menu, select the Data Query Tool. Use keywords to find up to ten price series to download, then specify a period of time up to one year.
ARCHIVES
Why should I use Archives? Can’t I get archive reports on each report page?
You can get archived reports on each report page by using the date picker in the upper right of the report page, then selecting Export > Export to PDF.
If you need to download more than one archived report, it’s quicker to access archived reports through the Archives menu.
▶️ How to Find Your Report on OPIS Context (33 sec)
▶️ Features of Your OPIS Context Report (1 min)
▶️ Create Your Own Dashboard on OPIS Context (2 min)
▶️ Access Archived Reports on OPIS Context (37 sec)
▶️ Creating Custom Segments on OPIS Context (2 min)
▶️ Using the Data Query Tool to Find Prices on OPIS Context (31 sec)
▶️ Accessing News and Alerts on OPIS Context (22 sec)
Need some additional help?
Email our Customer Support team at energycs@opisnet.com to request a personalized training session with a product specialist.
Someone will be in touch within two business days.
Customer Service
- Email: energycs@opisnet.com
- Phone: +1 301.966.7270
Sales
- Email: energysales@opisnet.com
- Phone: +1 301.966.7270

